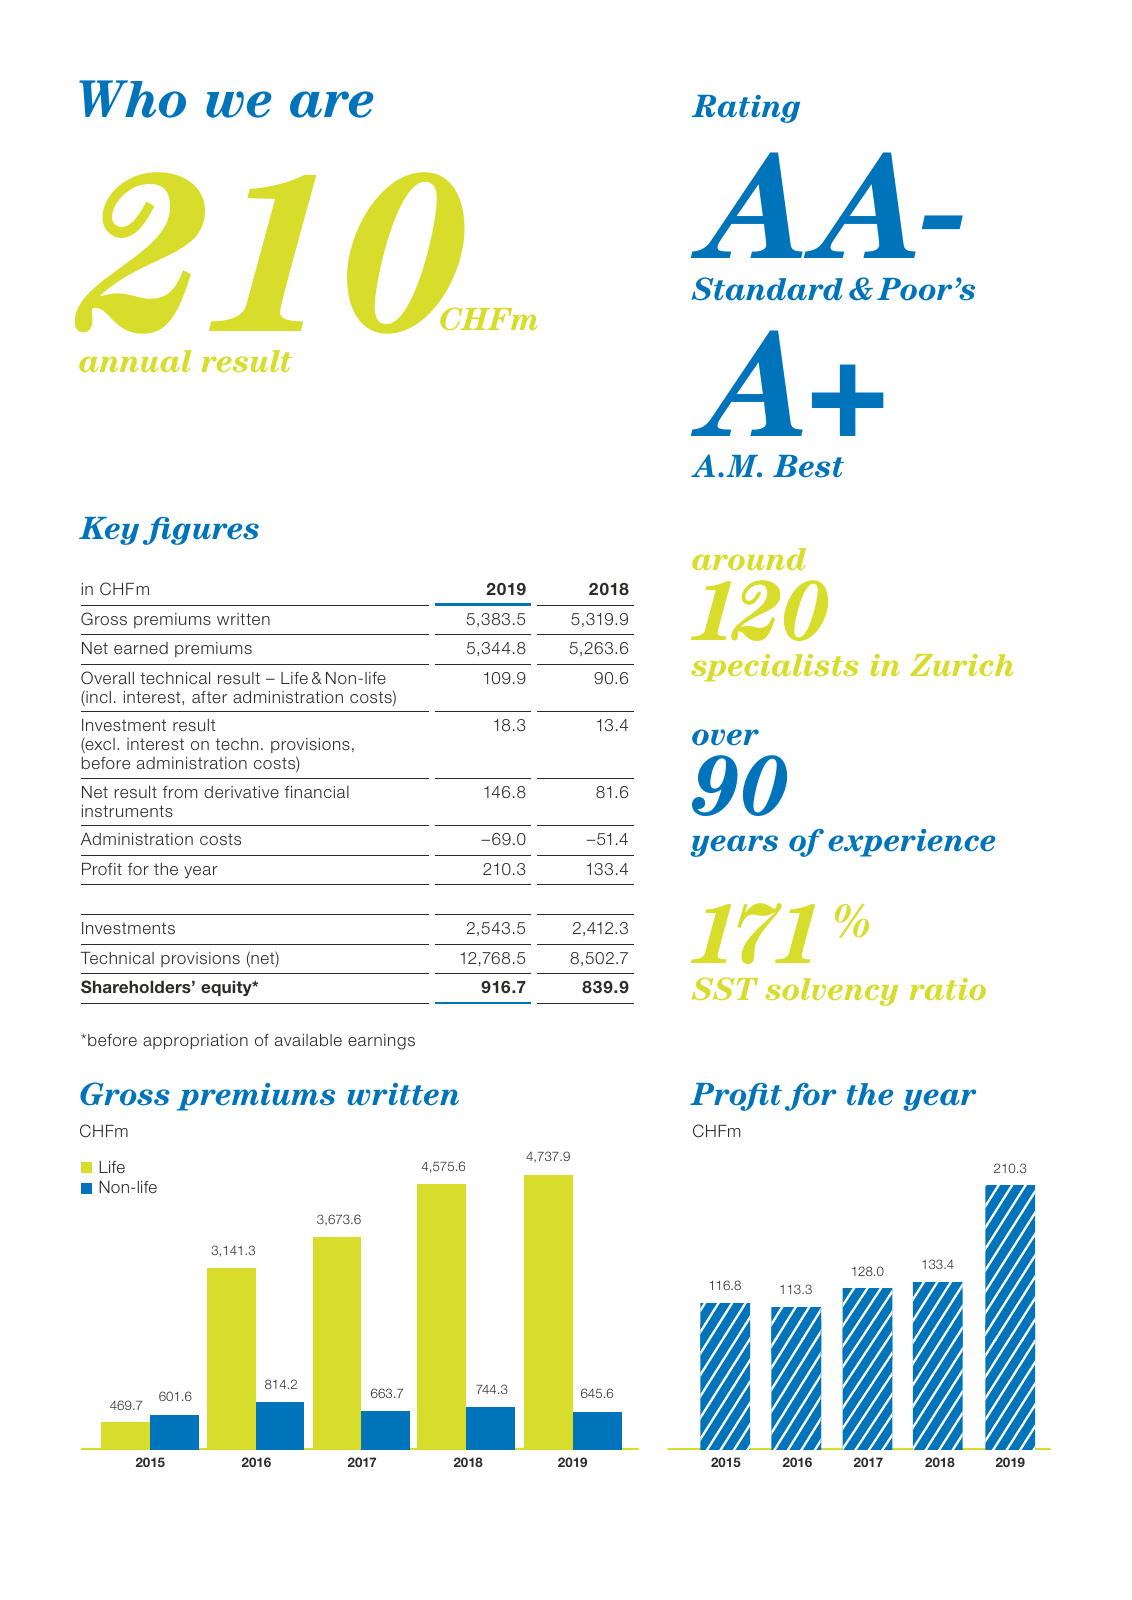
210CHFm annual result 0 30 60 90 120 150 2015 2016 116 8 2017 113 3 2018 128 0 2019 133 4 210 3 Profit for the year CHFm Gross premiums written CHFm 2018201720162015 663 7 3 673 6 3 141 3 814 2 469 7 601 6 2019 7 44 3 4 575 6 645 6 4 737 9 Key figures in CHF m 2019 2018 Gross premiums written 5 383 5 5 319 9 Net earned premiums 5 344 8 5 263 6 Overall technical result Life Non life incl interest after administration costs 109 9 90 6 Investment result excl interest on techn provisions before administration costs 18 3 13 4 Net result from derivative financial instruments 146 8 81 6 Administration costs 69 0 51 4 Profit for the year 210 3 133 4 Investments 2 543 5 2 412 3 Technical provisions net 12 768 5 8 502 7 Shareholders equity 916 7 839 9 before appropriation of available earnings Life Non life over years of experience 90 SST solvency ratio 171 around specialists in Zurich 120 Rating AA Standard Poor s A A M Best Who we are NewRe AnnualReport 2019 Korrekt indd 2 27 04 20 09 42
Hinweis: Dies ist eine maschinenlesbare No-Flash Ansicht.
Klicken Sie hier um zur Online-Version zu gelangen.
Klicken Sie hier um zur Online-Version zu gelangen.