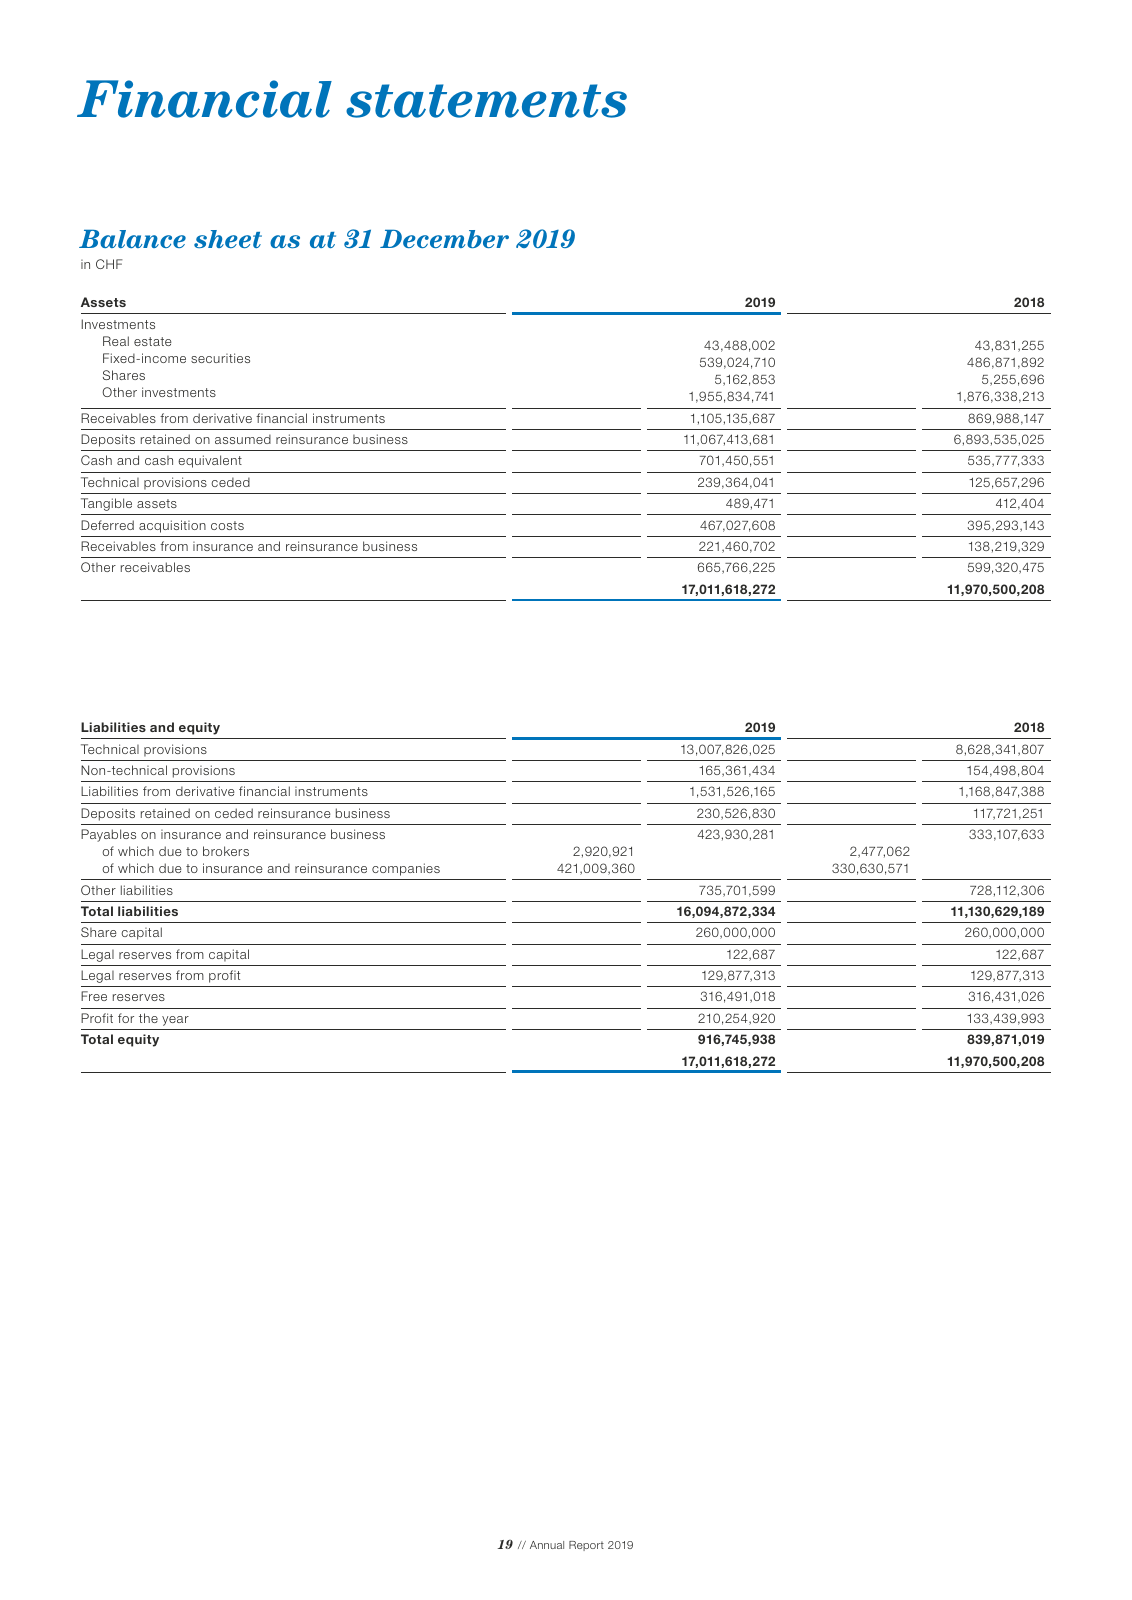
19 Annual Report 2019 Financial statements Balance sheet as at 31 December 2019 in CHF Assets 2019 2018 Investments Real estate Fixed income securities Shares Other investments 43 488 002 539 024 710 5 162 853 1 955 834 741 43 831 255 486 871 892 5 255 696 1 876 338 213 Receivables from derivative financial instruments 1 105 135 687 869 988 147 Deposits retained on assumed reinsurance business 11 067 413 681 6 893 535 025 Cash and cash equivalent 701 450 551 535 777 333 Technical provisions ceded 239 364 041 125 657 296 Tangible assets 489 471 412 404 Deferred acquisition costs 467 027 608 395 293 143 Receivables from insurance and reinsurance business 221 460 702 138 219 329 Other receivables 665 766 225 599 320 475 17 011 618 272 11 970 500 208 Liabilities and equity 2019 2018 Technical provisions 13 007 826 025 8 628 341 807 Non technical provisions 165 361 434 154 498 804 Liabilities from derivative financial instruments 1 531 526 165 1 168 847 388 Deposits retained on ceded reinsurance business 230 526 830 117 721 251 Payables on insurance and reinsurance business of which due to brokers of which due to insurance and reinsurance companies 2 920 921 421 009 360 423 930 281 2 477 062 330 630 571 333 107 633 Other liabilities 735 701 599 728 112 306 Total liabilities 16 094 872 334 11 130 629 189 Share capital 260 000 000 260 000 000 Legal reserves from capital 122 687 122 687 Legal reserves from profit 129 877 313 129 877 313 Free reserves 316 491 018 316 431 026 Profit for the year 210 254 920 133 439 993 Total equity 916 745 938 839 871 019 17 011 618 272 11 970 500 208 NewRe AnnualReport 2019 Korrekt indd 19 27 04 20 09 43
Hinweis: Dies ist eine maschinenlesbare No-Flash Ansicht.
Klicken Sie hier um zur Online-Version zu gelangen.
Klicken Sie hier um zur Online-Version zu gelangen.