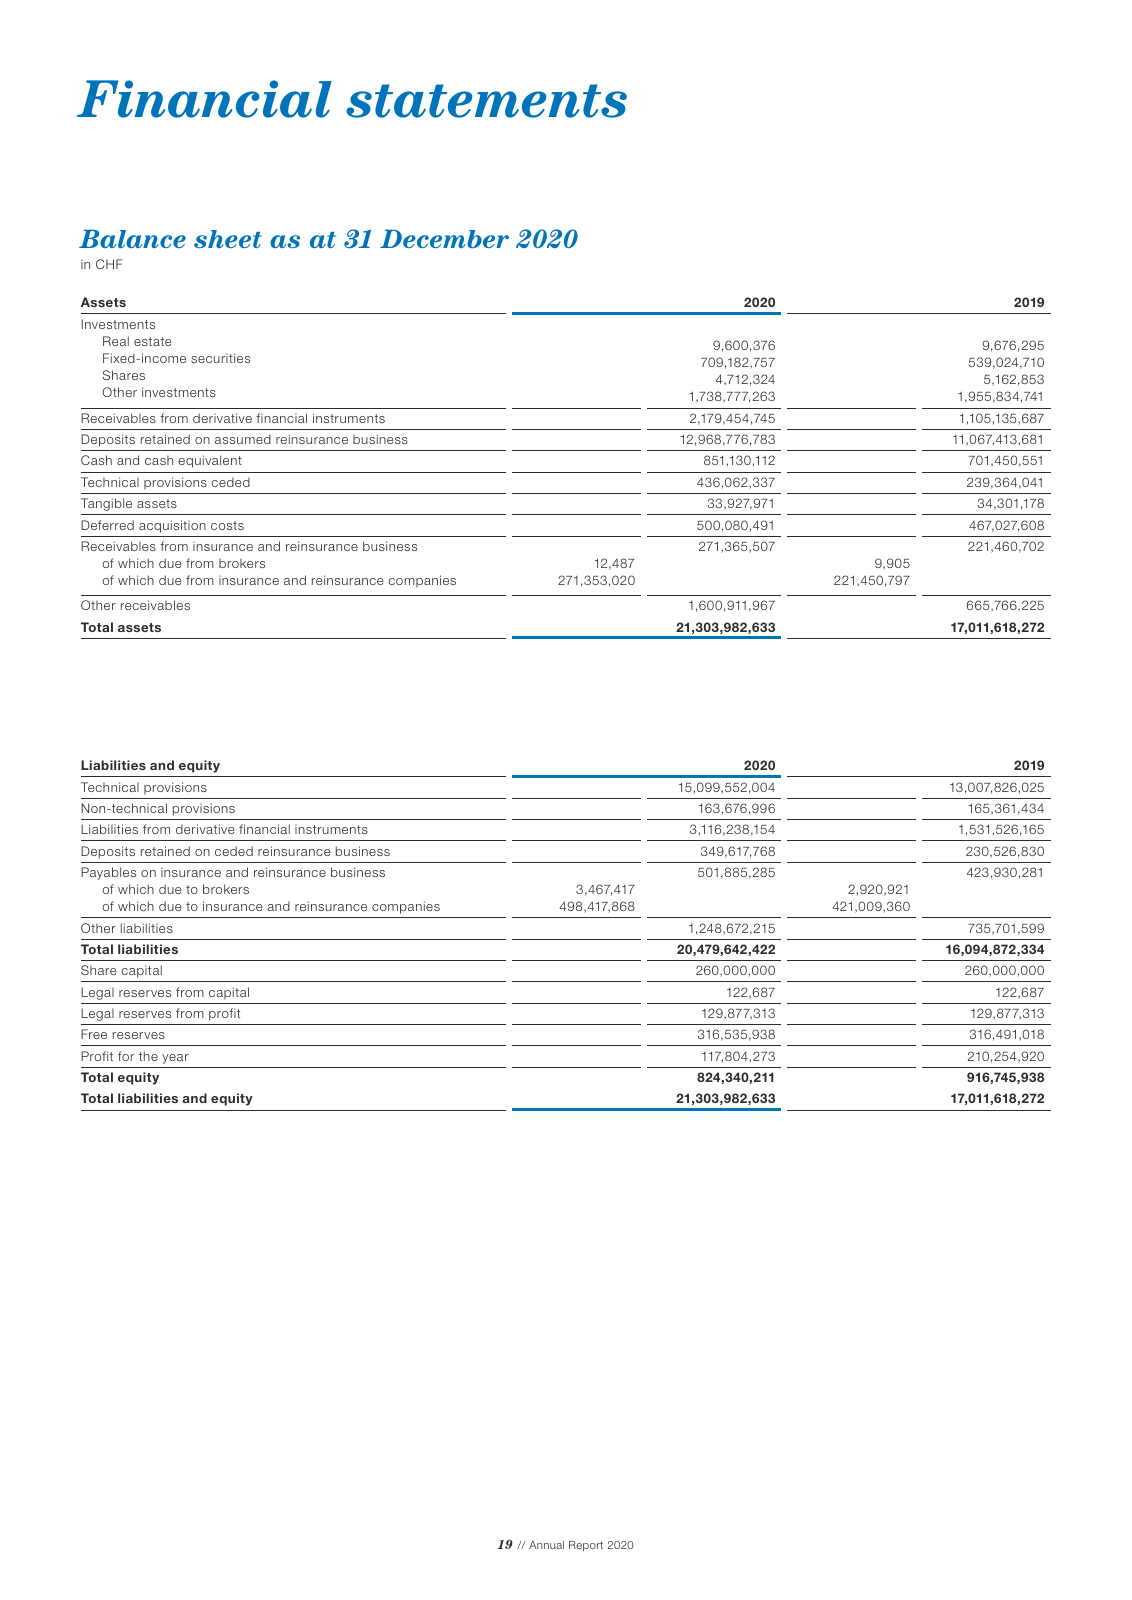
19 Annual Report 2020 Financial statements Balance sheet as at 31 December 2020 in CHF Assets 2020 2019 Investments Real estate Fixed income securities Shares Other investments 9 600 376 709 182 757 4 712 324 1 738 777 263 9 676 295 539 024 710 5 162 853 1 955 834 741 Receivables from derivative financial instruments 2 179 454 745 1 105 135 687 Deposits retained on assumed reinsurance business 12 968 776 783 11 067 413 681 Cash and cash equivalent 851 130 112 701 450 551 Technical provisions ceded 436 062 337 239 364 041 Tangible assets 33 927 971 34 301 178 Deferred acquisition costs 500 080 491 467 027 608 Receivables from insurance and reinsurance business of which due from brokers of which due from insurance and reinsurance companies 12 487 271 353 020 271 365 507 9 905 221 450 797 221 460 702 Other receivables 1 600 911 967 665 766 225 Total assets 21 303 982 633 17 011 618 272 Liabilities and equity 2020 2019 Technical provisions 15 099 552 004 13 007 826 025 Non technical provisions 163 676 996 165 361 434 Liabilities from derivative financial instruments 3 116 238 154 1 531 526 165 Deposits retained on ceded reinsurance business 349 617 768 230 526 830 Payables on insurance and reinsurance business of which due to brokers of which due to insurance and reinsurance companies 3 467 417 498 417 868 501 885 285 2 920 921 421 009 360 423 930 281 Other liabilities 1 248 672 215 735 701 599 Total liabilities 20 479 642 422 16 094 872 334 Share capital 260 000 000 260 000 000 Legal reserves from capital 122 687 122 687 Legal reserves from profit 129 877 313 129 877 313 Free reserves 316 535 938 316 491 018 Profit for the year 117 804 273 210 254 920 Total equity 824 340 211 916 745 938 Total liabilities and equity 21 303 982 633 17 011 618 272 NewRe AnnualReport 2020 indd 19 28 04 21 19 06
Hinweis: Dies ist eine maschinenlesbare No-Flash Ansicht.
Klicken Sie hier um zur Online-Version zu gelangen.
Klicken Sie hier um zur Online-Version zu gelangen.