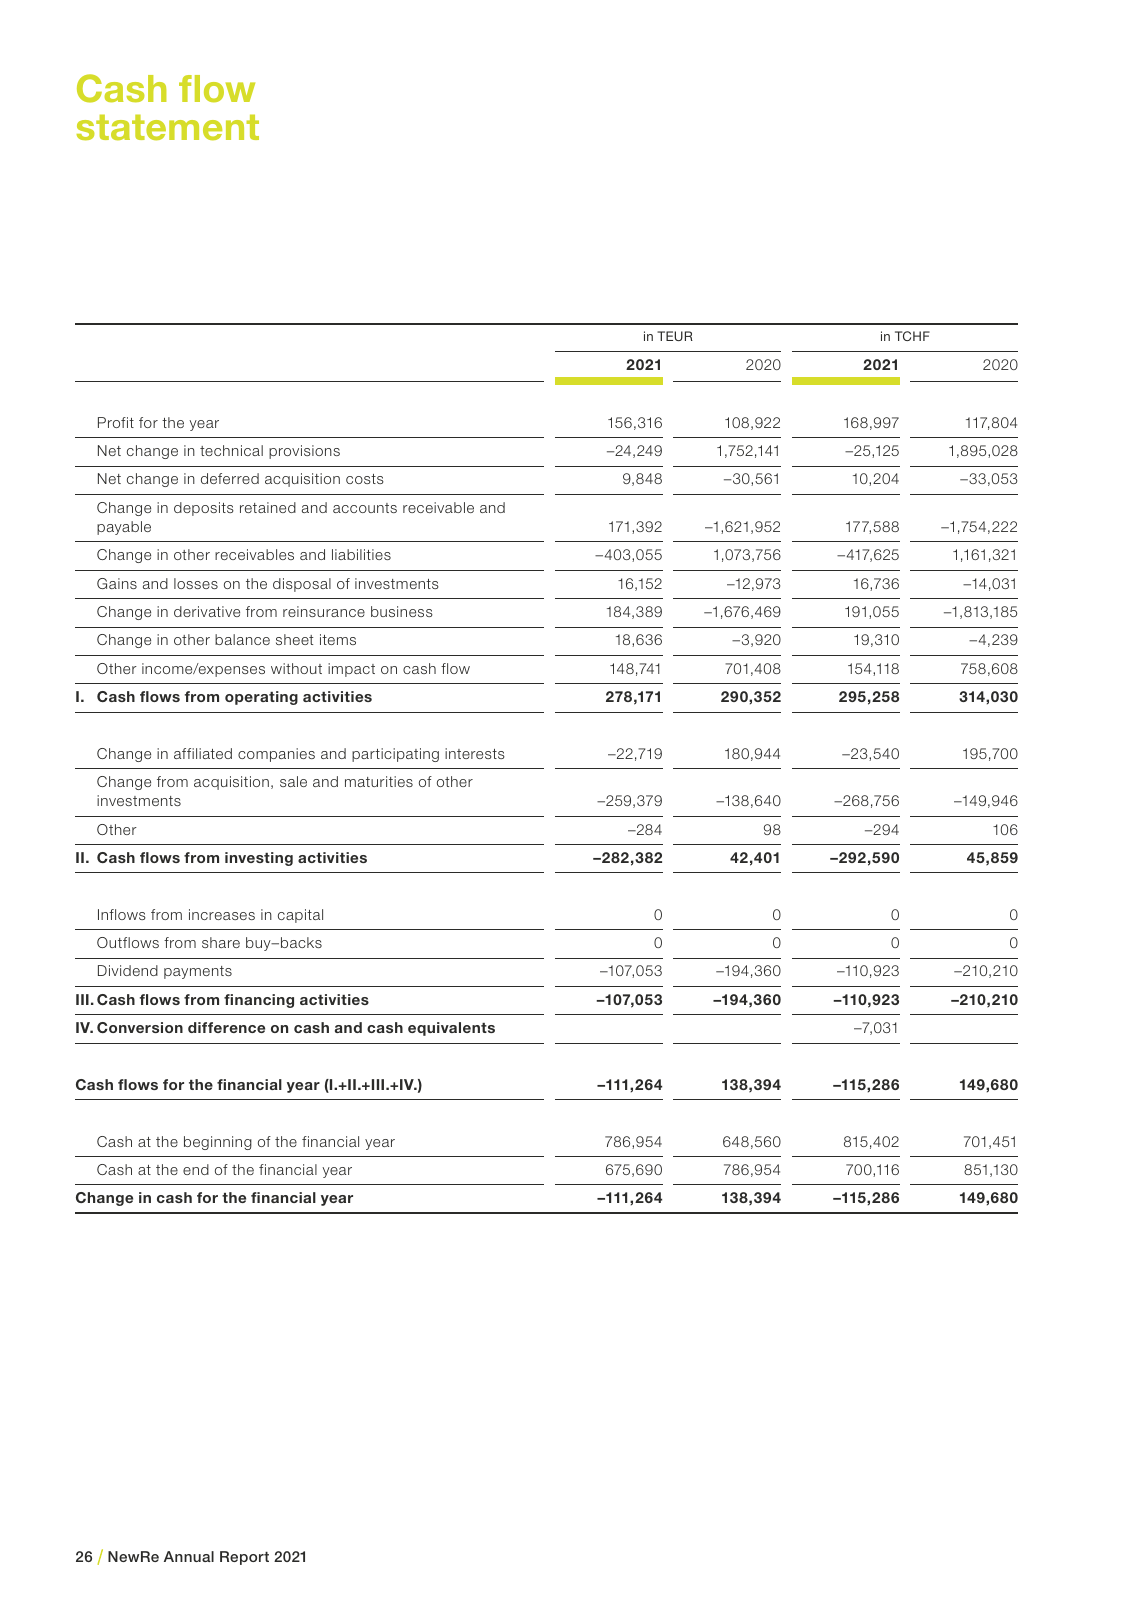
26 NewRe Annual Report 2021 in TEUR in TCHF 2021 2020 2021 2020 Profit for the year 156 316 108 922 168 997 117 804 Net change in technical provisions 24 249 1 752 141 25 125 1 895 028 Net change in deferred acquisition costs 9 848 30 561 10 204 33 053 Change in deposits retained and accounts receivable and payable 171 392 1 621 952 177 588 1 754 222 Change in other receivables and liabilities 403 055 1 073 756 417 625 1 161 321 Gains and losses on the disposal of investments 16 152 12 973 16 736 14 031 Change in derivative from reinsurance business 184 389 1 676 469 191 055 1 813 185 Change in other balance sheet items 18 636 3 920 19 310 4 239 Other income expenses without impact on cash flow 148 741 701 408 154 118 758 608 I Cash flows from operating activities 278 171 290 352 295 258 314 030 Change in affiliated companies and participating interests 22 719 180 944 23 540 195 700 Change from acquisition sale and maturities of other investments 259 379 138 640 268 756 149 946 Other 284 98 294 106 II Cash flows from investing activities 282 382 42 401 292 590 45 859 Inflows from increases in capital 0 0 0 0 Outflows from share buy backs 0 0 0 0 Dividend payments 107 053 194 360 110 923 210 210 III Cash flows from financing activities 107 053 194 360 110 923 210 210 IV Conversion difference on cash and cash equivalents 7 031 Cash flows for the financial year I II III IV 111 264 138 394 115 286 149 680 Cash at the beginning of the financial year 786 954 648 560 815 402 701 451 Cash at the end of the financial year 675 690 786 954 700 116 851 130 Change in cash for the financial year 111 264 138 394 115 286 149 680 Cash flow statement NewRe Annual Report 2021 Inhalt indd 26 25 04 22 10 19
Hinweis: Dies ist eine maschinenlesbare No-Flash Ansicht.
Klicken Sie hier um zur Online-Version zu gelangen.
Klicken Sie hier um zur Online-Version zu gelangen.