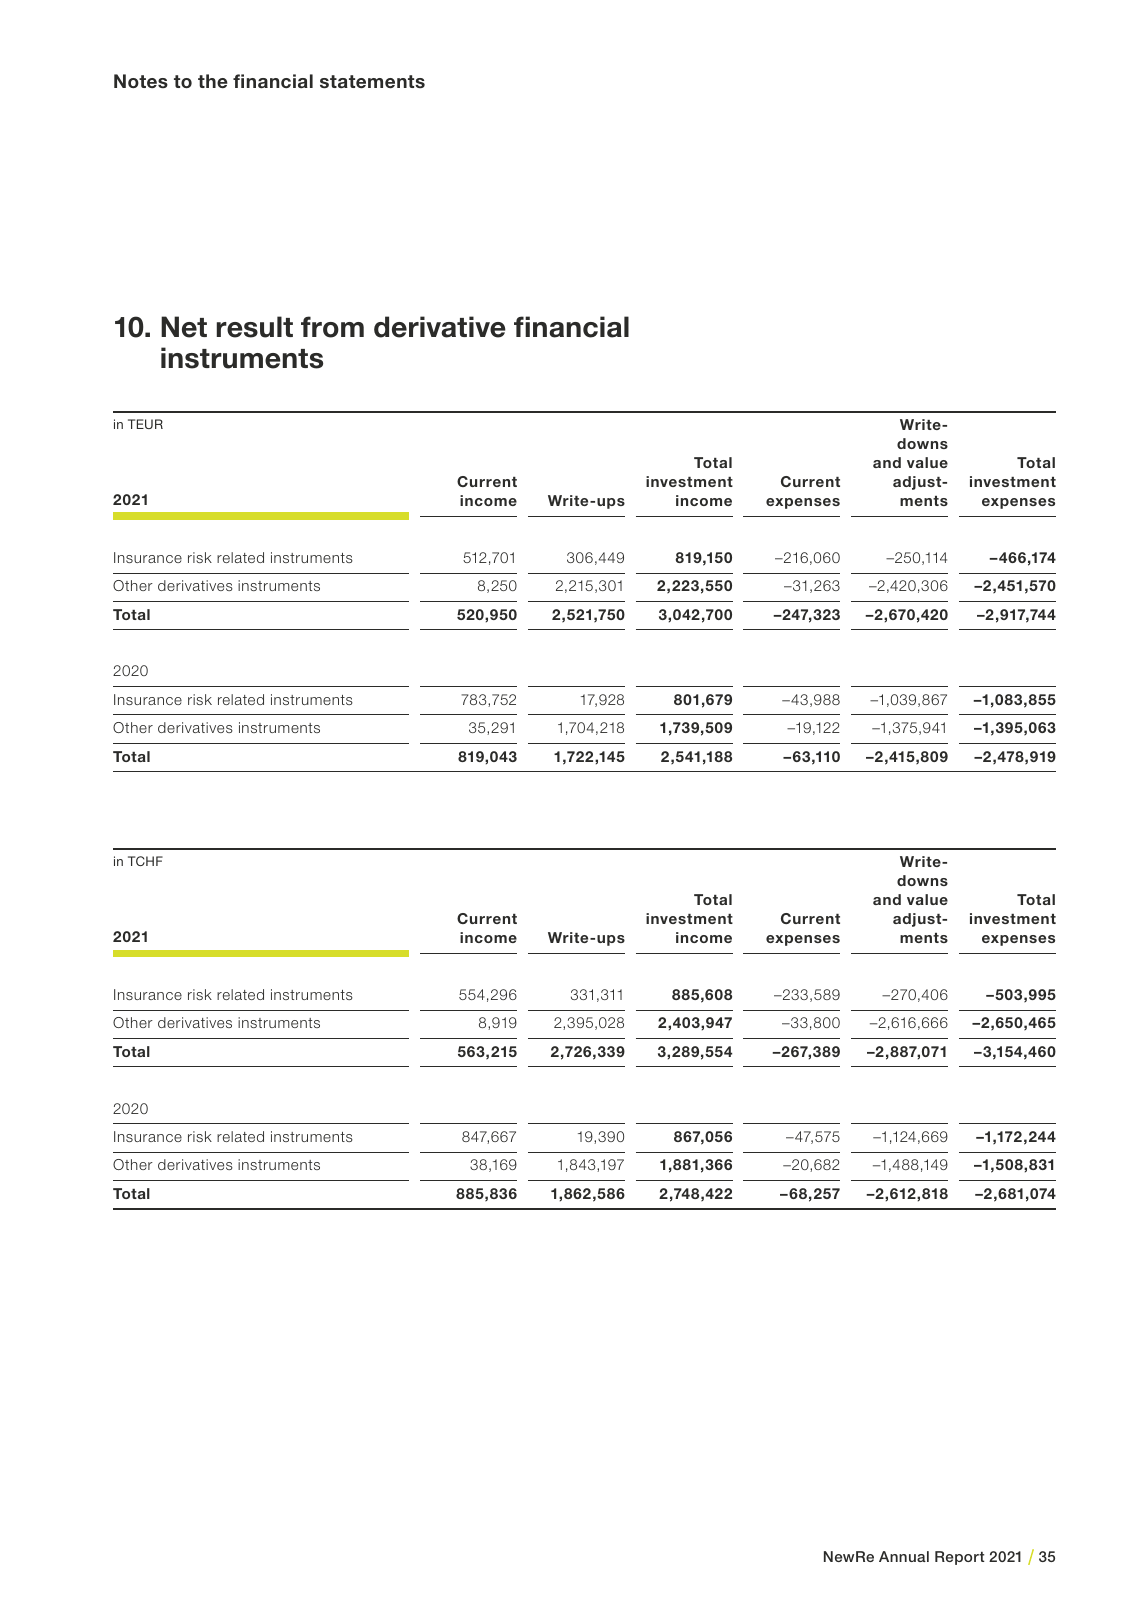
NewRe Annual Report 2021 35 10 Net result from derivative financial instruments in TEUR Current income Write ups Total investment income Current expenses Write downs and value adjust ments Total investment expenses2021 Insurance risk related instruments 512 701 306 449 819 150 216 060 250 114 466 174 Other derivatives instruments 8 250 2 215 301 2 223 550 31 263 2 420 306 2 451 570 Total 520 950 2 521 750 3 042 700 247 323 2 670 420 2 917 744 2020 Insurance risk related instruments 783 752 17 928 801 679 43 988 1 039 867 1 083 855 Other derivatives instruments 35 291 1 704 218 1 739 509 19 122 1 375 941 1 395 063 Total 819 043 1 722 145 2 541 188 63 110 2 415 809 2 478 919 in TCHF Current income Write ups Total investment income Current expenses Write downs and value adjust ments Total investment expenses2021 Insurance risk related instruments 554 296 331 311 885 608 233 589 270 406 503 995 Other derivatives instruments 8 919 2 395 028 2 403 947 33 800 2 616 666 2 650 465 Total 563 215 2 726 339 3 289 554 267 389 2 887 071 3 154 460 2020 Insurance risk related instruments 847 667 19 390 867 056 47 575 1 124 669 1 172 244 Other derivatives instruments 38 169 1 843 197 1 881 366 20 682 1 488 149 1 508 831 Total 885 836 1 862 586 2 748 422 68 257 2 612 818 2 681 074 Notes to the financial statements NewRe Annual Report 2021 Inhalt indd 35 25 04 22 10 19
Hinweis: Dies ist eine maschinenlesbare No-Flash Ansicht.
Klicken Sie hier um zur Online-Version zu gelangen.
Klicken Sie hier um zur Online-Version zu gelangen.